
Analytics: understand your audience and results
A tour of GA4 views: traffic, acquisition, pages, audience and conversions.
On this page
What does Analytics show in Cuik?
Google Analytics helps explain what happens after visitors arrive: audience, acquisition channels, pages viewed and recorded events. Search Console describes Google visibility; Analytics complements it with site usage.
Open Analytics, connect a Google account and select a GA4 property. Cuik reads existing data. It does not install a tracking tag or create your events in GA4.
Understand the overview
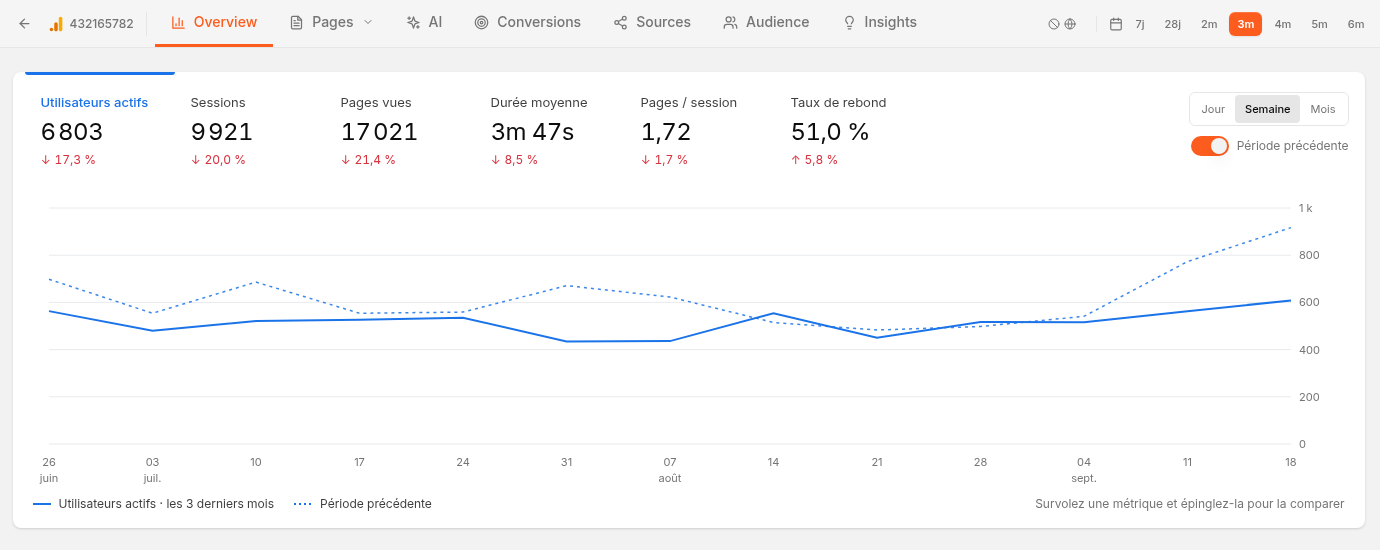 Real interface: select a metric, inspect its trend and compare it with the preceding period. The capture uses French interface labels.
The metrics provide context; the chart shows when a change occurs. Select a metric and choose Day, Week or Month. Comparison with the preceding period helps place recent changes in context.
| Metric | What it represents |
|---|---|
| Active users | The active audience measured by GA4. |
| Sessions | Visits; one person may make several. |
| Page views | Recorded views, including repeated views. |
| Duration and pages per session | Indicators for understanding the depth of visits. |
| Bounce rate | The proportion of sessions without engagement under GA4's criteria. |
GA4 bounce rate does not simply mean visiting a single page: see Google's definition.
Find the traffic sources
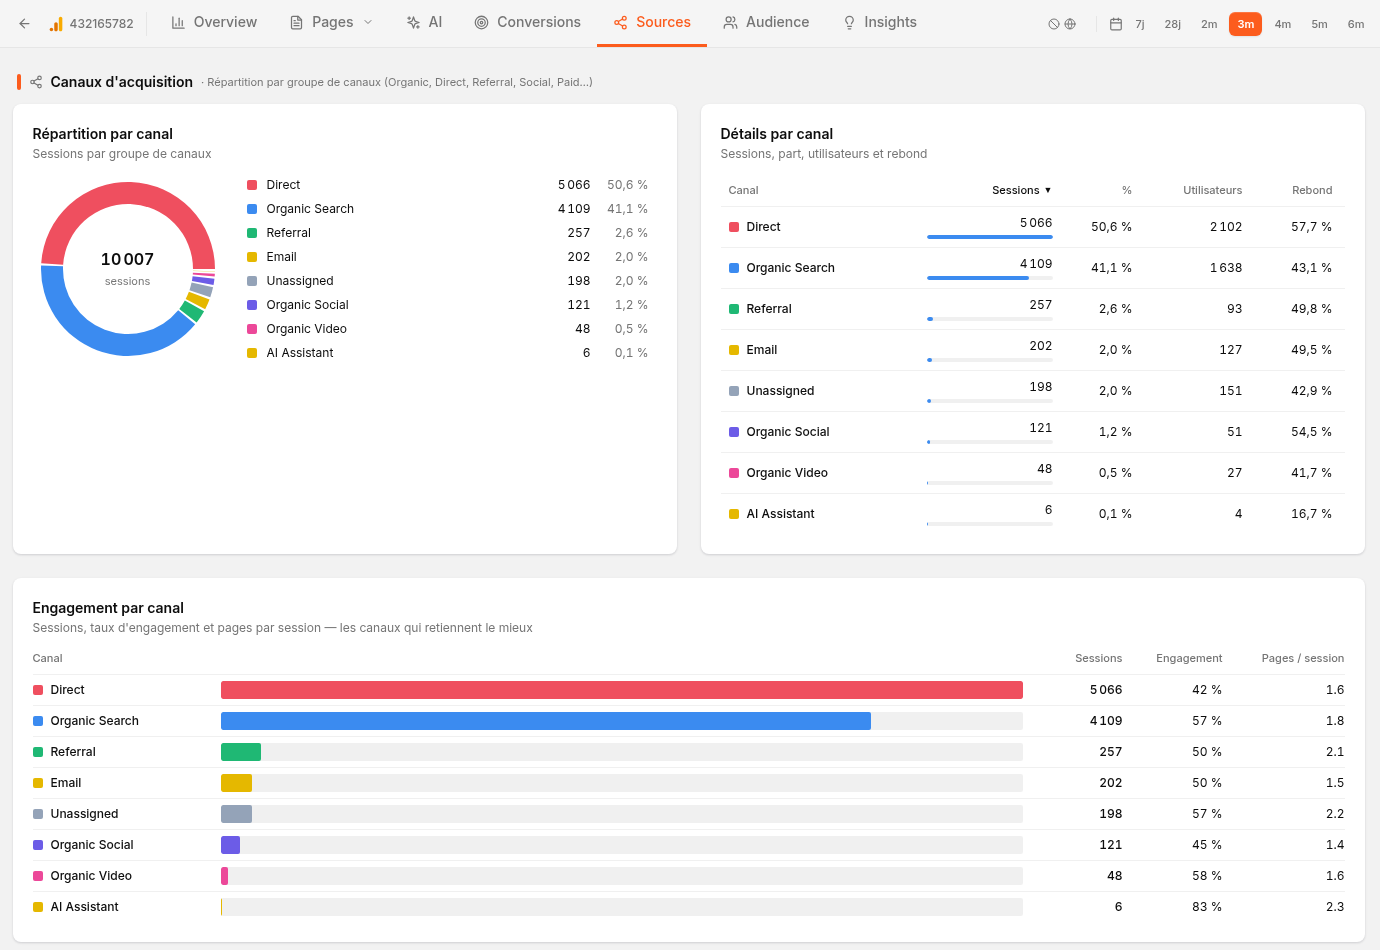 Sources connects visit volumes with acquisition channels and referring websites.
Sources answers “where do visits come from?”. Start with channels, then inspect referrers. Audience covers countries and devices. Distributions help compare shares; volumes show how large those shares are in practice.
The AI view identifies AI sources present in the measured traffic. It does not count every mention in assistants, or visits whose referrer was lost.
Choose the right page view
| View | Useful question |
|---|---|
| Pages | Which content is viewed, with what engagement? |
| Landing Pages | Where do visits begin? |
| Directories | Which groups of paths contribute to activity? |
| Exit Pages | Which pages show a non-engagement signal worth examining? |
The Exit Pages index is calculated from views and engagement; it is not an exact GA4 exit count. Tables do not all share the same measurement scope: applying a page filter does not turn a session metric into a page metric.
Follow business results
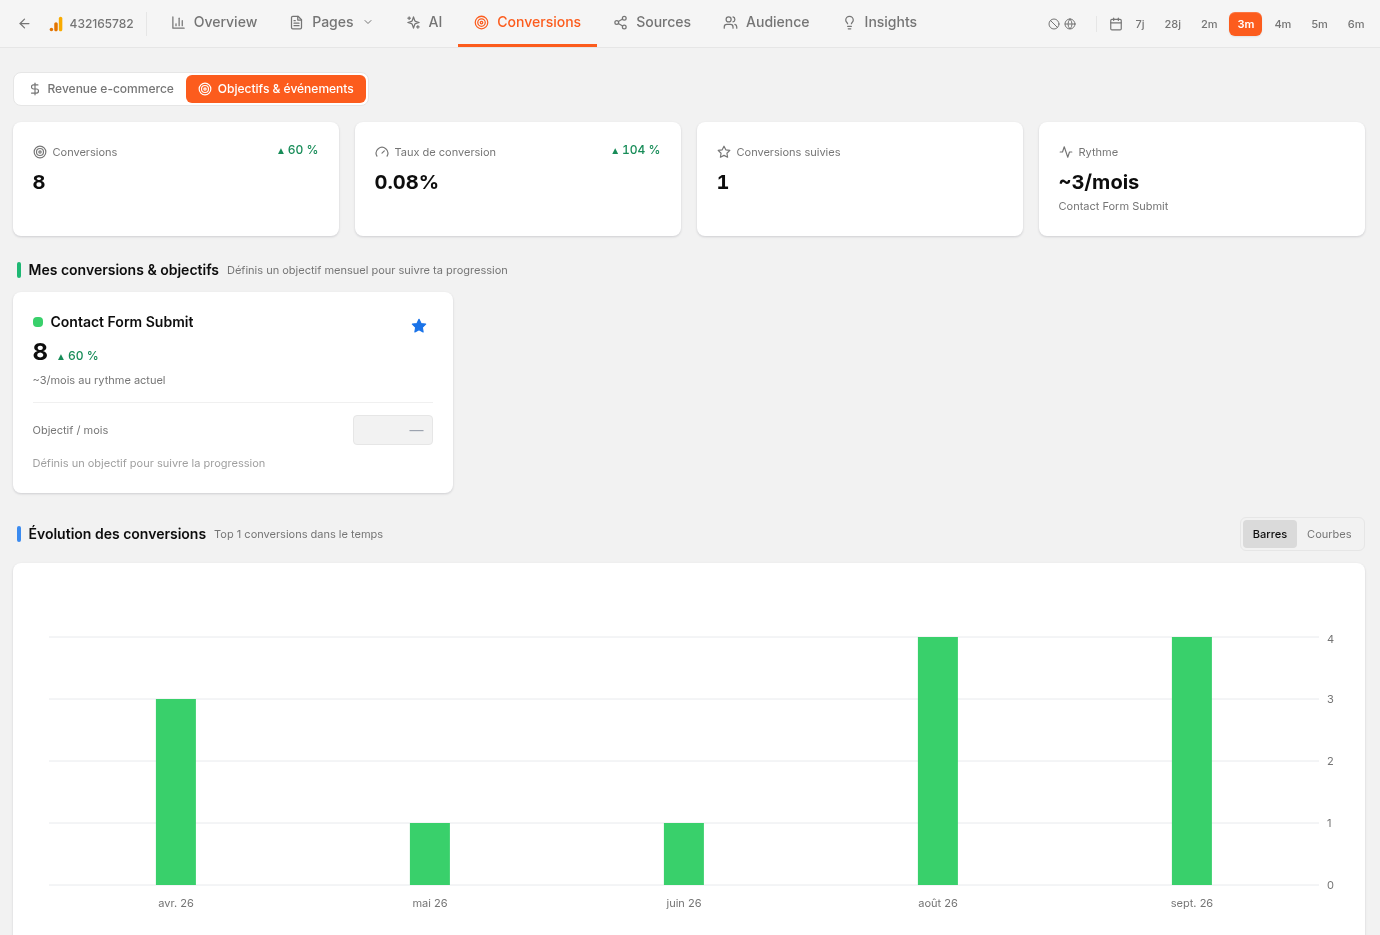 Conversions relies on events actually available in the connected property.
In Conversions, follow actions that matter to the business: form submissions, sign-ups or purchases, depending on the configuration. E-commerce views require correctly recorded events and revenue in GA4.
Example: organic traffic grows, but enquiries stay flat. Compare landing pages, engagement and relevant events. Visit volume alone does not describe the business result.
Before comparing figures
Check the property, dates, filters and event definitions. Consent choices, tracking setup and GA4 processing affect the available data. A Search Console click does not necessarily correspond to one Analytics session.
For connection instructions, options and report usage, see Analyse Google Analytics data in Cuik.