
Log Analyzer: see how bots crawl your site
Read hits, HTTP responses, bots and URL coverage in your server logs.
On this page
What is the Log Analyzer for?
Server logs record requests received by your site. They let you inspect requested URLs, HTTP responses and declared agents, including bots. A Cuik crawl shows what its crawler found; logs show requests present in the files you imported.
Open Log Analyzer and import access logs. Check dates, domain and exclusion options, since they determine the analysis scope. Reading an existing log file requires no tracking code installed on your site.
Read volume and responses
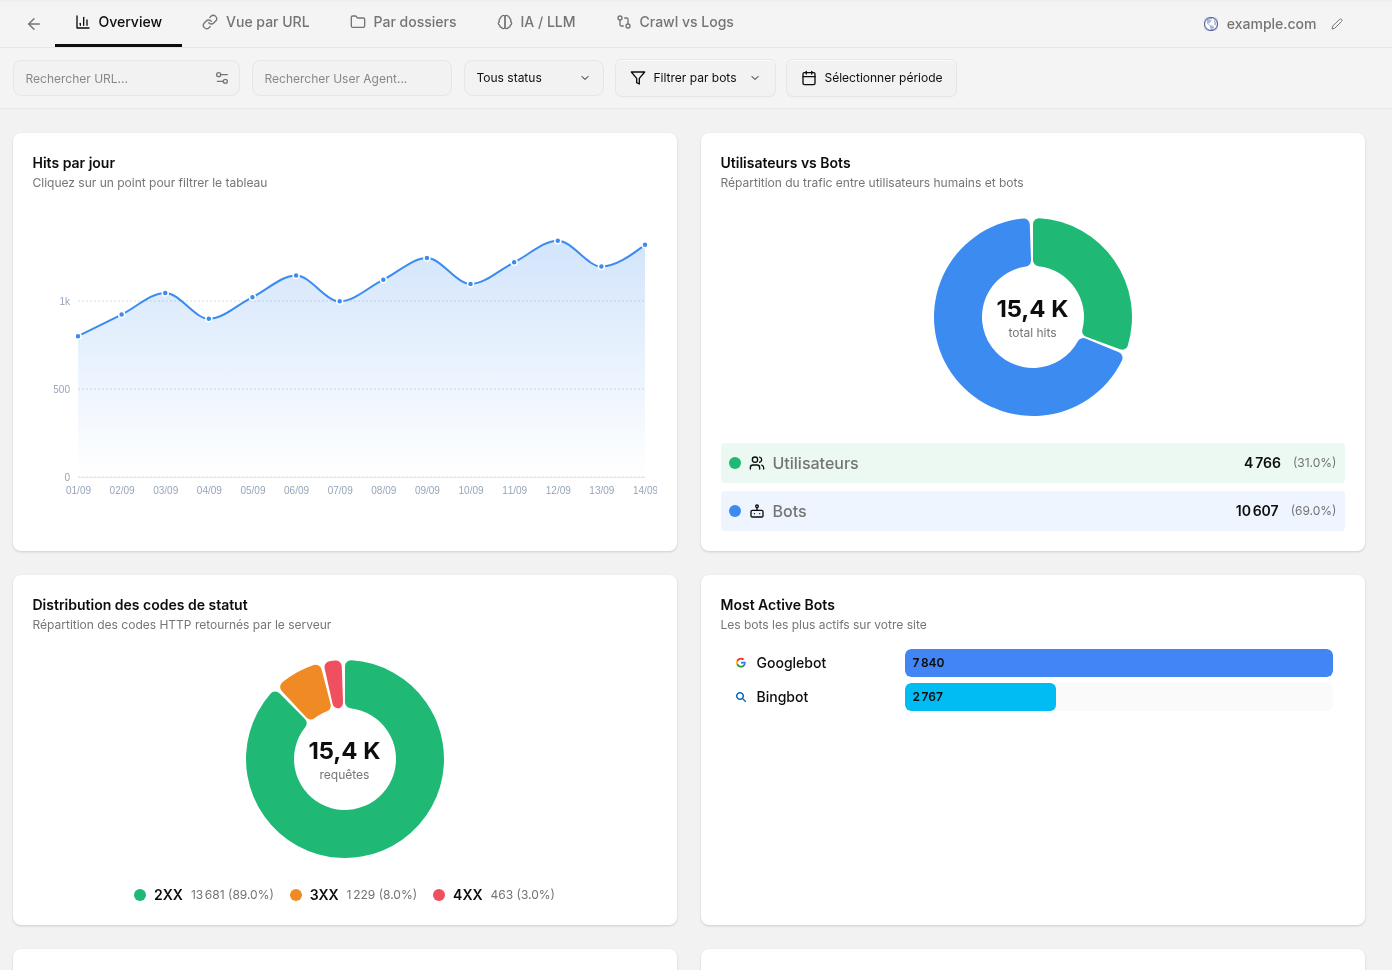 Real Cuik interface with fictional sample logs for this presentation. Interface labels in the capture are in French.
| Chart | What it shows | What it helps with |
|---|---|---|
| Hits per day | Requests by date. | Spot a peak, dip or change in activity. |
| Users vs Bots | Distribution by agent classification. | Understand the share of requests attributed to bots. |
| Status code distribution | Response volumes by HTTP code. | Compare successful responses, redirects and errors. |
| Most Active Bots | Bots generating the most requests. | Identify which agents use the server most. |
A hit is a request, not a visitor or an Analytics page view. One page can generate several requests. Bot classification uses the information available in logs; an agent name alone is not proof of identity.
Observe changes over time
Status Codes by Day and Top Bots by Day show how responses and bot activity vary over time. A stable overall total can conceal increasing errors or a change in the dominant agent.
Use date, bot and URL filters to isolate the pattern. Before concluding that crawling declined, verify that the file covers the entire period and that part of the logs has not been omitted.
Understand URL coverage
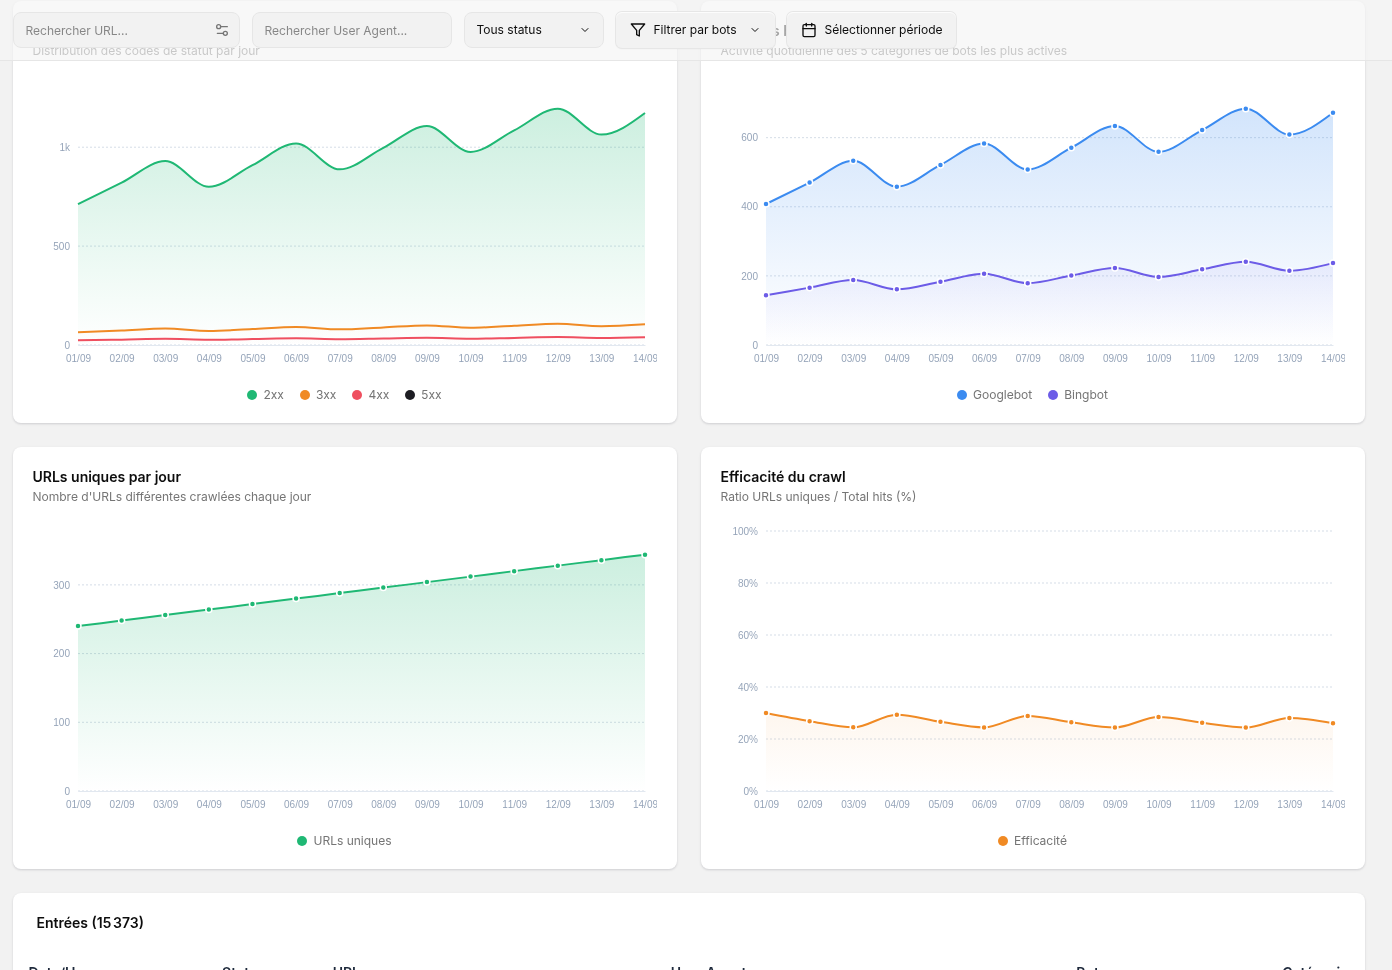 Fictional example data: distinguish request volume from the variety of requested URLs.
Unique URLs per day counts distinct URLs that received a request. Crawl efficiency relates that variety to the number of hits: a low ratio can indicate many repeat requests to the same URLs. It is not a Google quality score.
Example: hits increase but unique URLs stay flat. Inspect the agents and paths involved: one family of URLs may account for repeated visits.
Examine the log entries
The table details requests, including timestamp, URL, status and agent. Use it to verify what the charts summarise. URL and directory views help locate areas receiving the most visits. Crawl vs Logs, when a compatible crawl is associated, compares URLs explored by Cuik with those found in logs.
A URL visited by a bot is not necessarily indexed. A URL without a hit in the file may have been visited outside the imported period.
Prepare useful files
Keep a comparable scope between imports: the same servers, duration and static-resource exclusions. Incomplete application logs or a caching layer can give a partial view of requests.
Do not put raw logs in a public report: URLs or agents may contain sensitive information. Present useful aggregates and necessary examples. Complete the technical picture with Crawl and Search Console.