
Search Console: understand your Google visibility
Read trends, queries, pages, seasonality and clusters.
On this page
What does Search Console show in Cuik?
Search Console describes your site's presence in Google results: appearances, clicks and the associated searches. It does not measure the site's entire audience; Analytics covers that different need.
From Search Console, connect a Google account with access to your property, then open the site. Access is read-only: Cuik does not change your site's content.
Read the chart and metrics
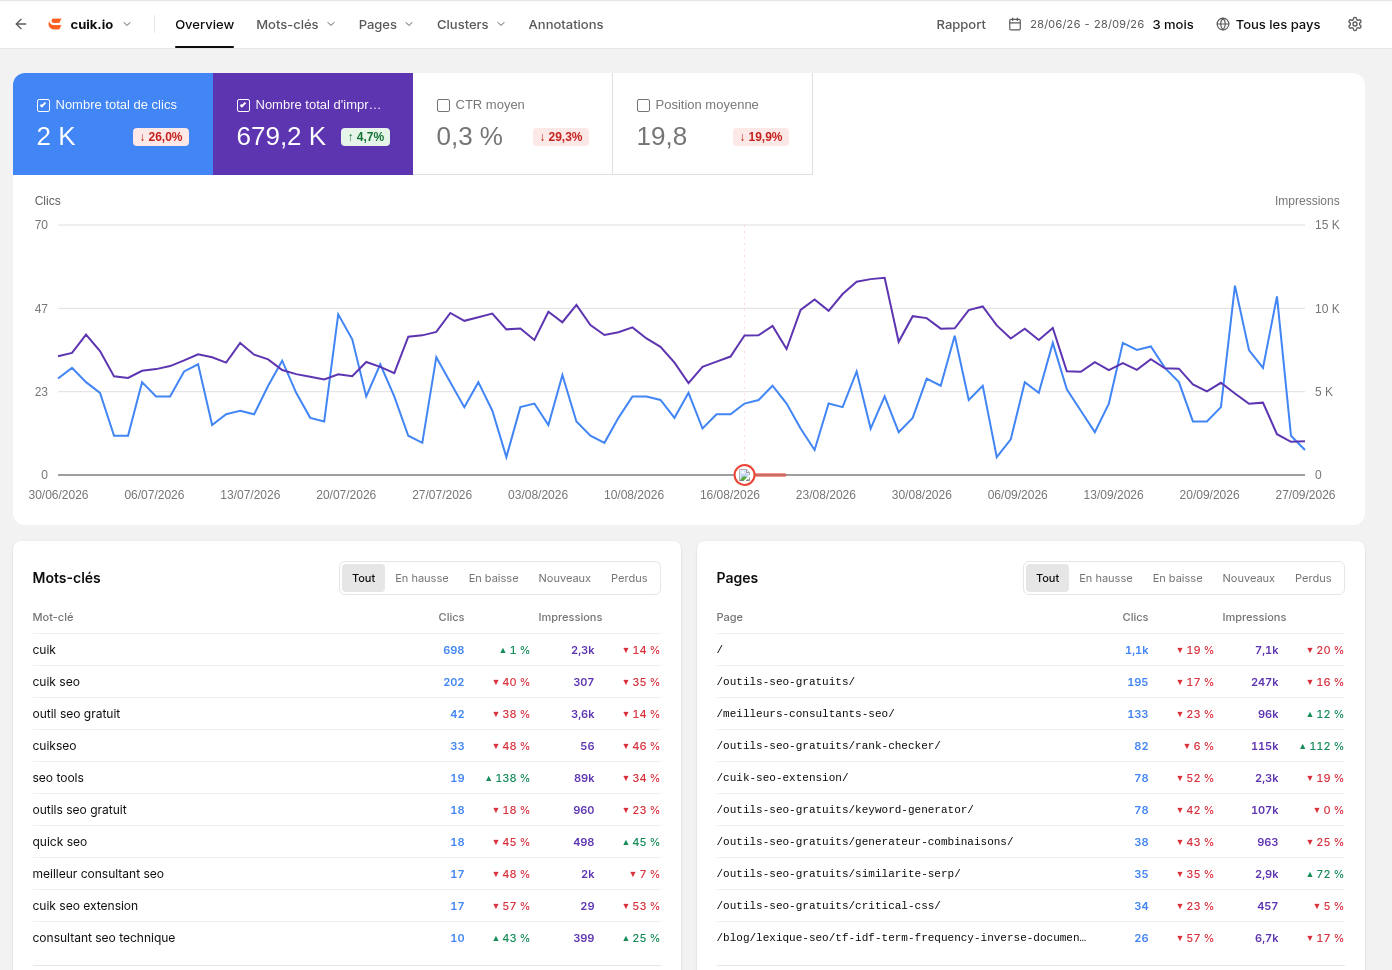 Real Cuik site data. Start by checking the property, dates and filters. The captured interface uses French labels.
| Metric | How to read it |
|---|---|
| Clicks | Clicks from Google results to your property. |
| Impressions | Appearances counted by Google in its results. |
| CTR | Clicks as a proportion of impressions. |
| Average position | Google's average position over the selected scope, not one fixed ranking for every search. |
Choose a period, metric and display interval. Weekly aggregation makes trends easier to read when individual days vary. Comparisons need a consistent scope: countries, devices, pages and search type.
Example: impressions increase but clicks do not. Inspect queries and positions before blaming page titles: the site may have started appearing for new searches that generate few clicks yet.
Explore keywords and pages
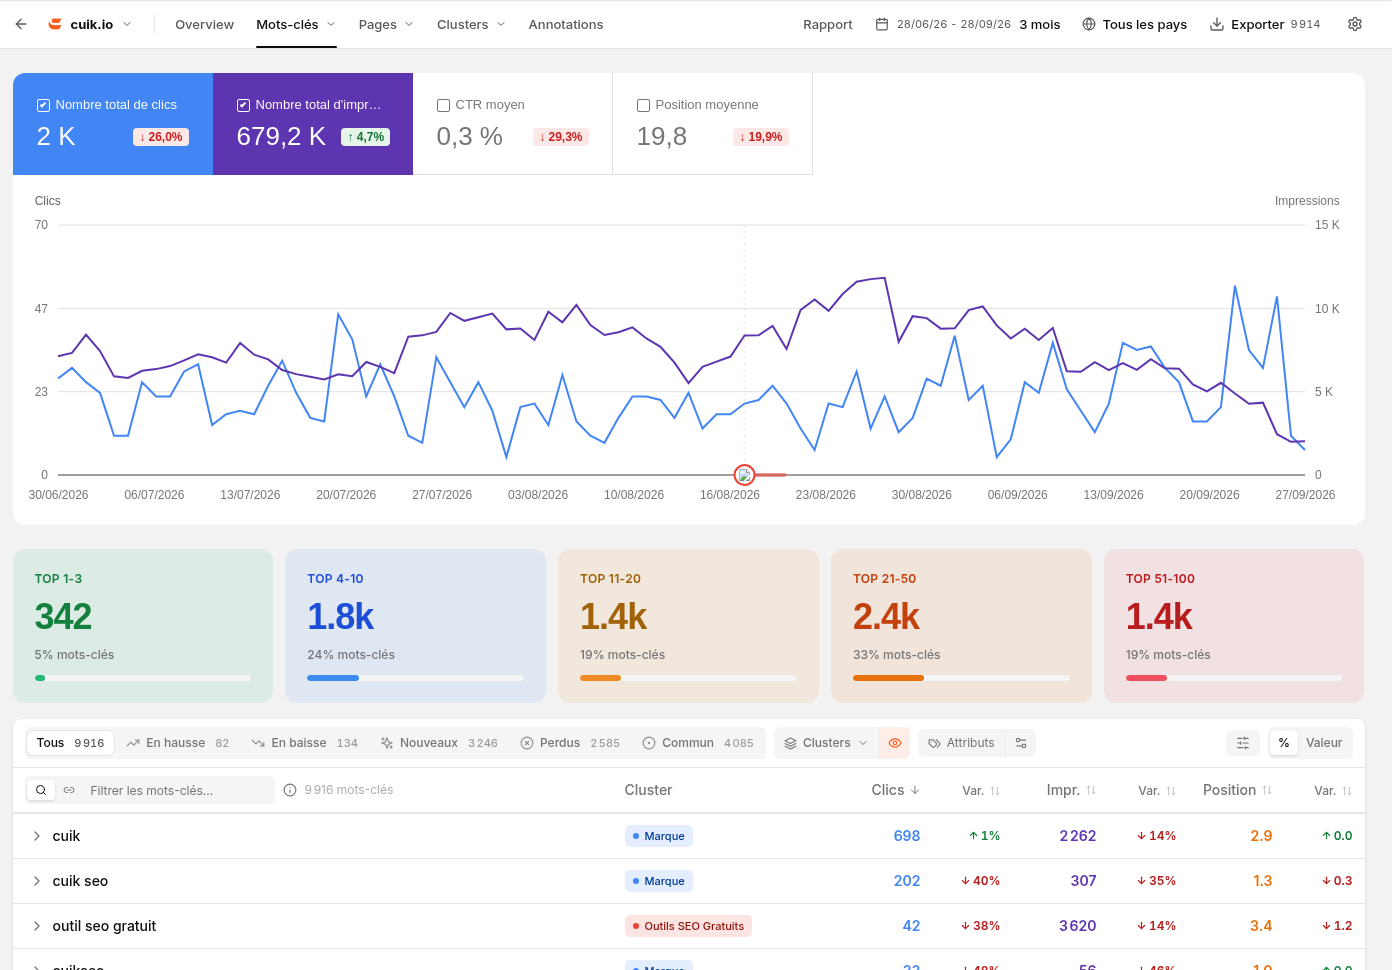 Query data helps move from an overall trend to specific searches. Captured on the Cuik website.
Keywords shows which queries contribute to performance. Pages shows which URLs receive it. Search and filter to isolate a service, category or group of pages, then compare their changes.
Click and impression changes help find gains and losses. Also inspect the absolute volumes: a large percentage change on a few clicks has a different impact from a smaller change on a major page.
Understand distributions and seasonality
| Chart or view | Question it answers |
|---|---|
| Countries and devices | Where does visibility come from, and on which devices? |
| Position distribution | How are queries distributed across ranking ranges? |
| Brand and non-brand | How much search activity matches the configured brand terms and rules? |
| Click and impression seasonality | When do peaks and dips occur in the available history? |
| Days of the week | Does the site have a recurring weekly pattern? |
Seasonality describes the available history; it is not a guaranteed forecast. Check date coverage before comparing incomplete years.
Organise with clusters and attributes
Clusters group queries or pages using your rules. Attributes add analysis dimensions, such as intent or content type. They help follow a part of the site without rebuilding the same selection each time.
The brand / non-brand split uses the saved configuration, including brand terms and clusters marked as branded. Check the project's definition before comparing figures, rather than inventing a different one for each report.
Understand the limits
Google withholds some queries for privacy. Property totals can therefore exceed the sum of visible rows. Filters, retrieval limits and data still being processed can also change the displayed scope. A zero and an unavailable value do not mean the same thing.
See Google's performance report documentation for counting rules. To understand visits after a click, continue with Analytics.