
Analyse Google Analytics data in Cuik
Connect GA4, explore acquisition and pages, follow conversions and bring the findings into a client report.
On this page
1. Connect a GA4 property
The Google Analytics view helps you understand what visitors do after reaching your website: which pages they view, where they come from and which actions are recorded. Search Console describes visibility in search results. The two sources answer different, complementary questions.
On your first connection, Google may display “Google hasn’t verified this app”: verification of Cuik is still in progress. An explanation appears before you continue to Google. You can choose to continue or cancel.
- Open Google Analytics and choose the button to connect your account or add another account.
- Select the Google account with access to your GA4 property and grant read access to Analytics data.
- Find the property in the list and open it. You can search by property name, property ID or connected Google account.
Connecting Cuik reads existing data. It does not install a tracking tag or configure events on your website.
Missing a property? Check the Google account’s permissions, then use the resynchronise button for that account. This refreshes the list of available properties. If Google blocks authorisation, keep the exact error message so the access issue can be identified.
2. Start with Overview
In Overview, select a period at the top right: 7 days, 28 days or 2–6 months. Periods end yesterday. Allow time for Google to process recent data.
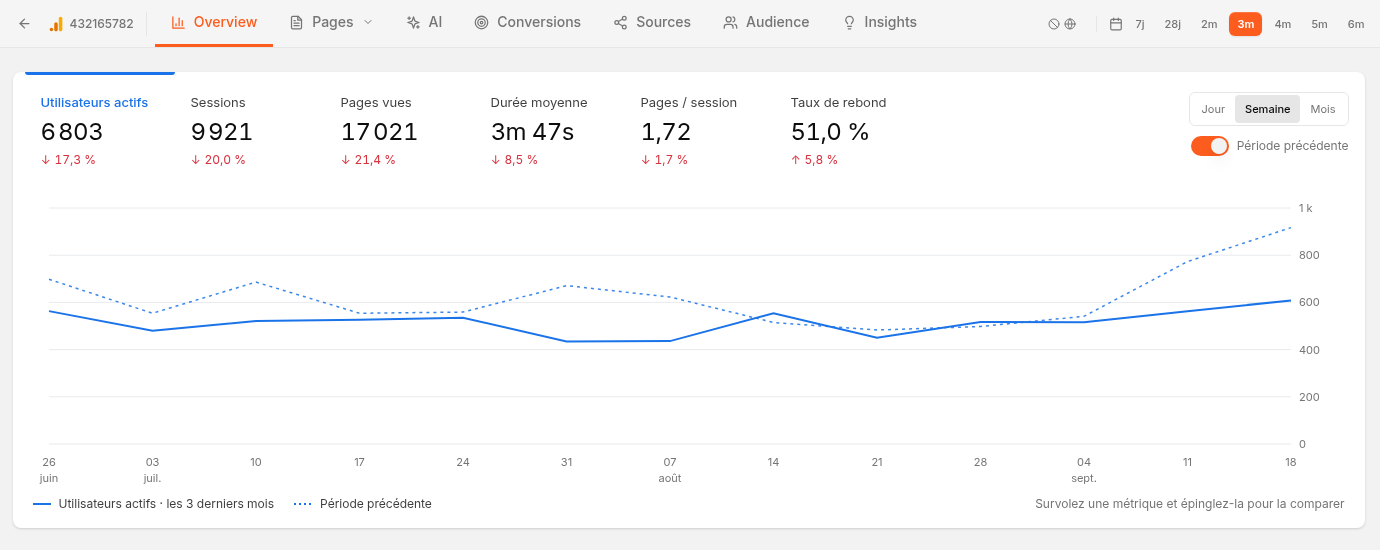 Actual Cuik interface in French: period, metrics and comparison with the previous period. Click to enlarge.
Click a metric to display its curve. You can pin another metric for comparison, choose a daily, weekly or monthly interval and toggle the previous-period comparison. Further down, charts break down acquisition, engagement and pages.
| Metric | What it tells you |
|---|---|
| Active users | The size of the active audience as defined by GA4, rather than the number of visits. |
| Sessions | Visit volume. The same person may return several times. |
| Page views | Recorded views, including repeated visits to the same page. |
| Average duration / pages per session | Depth of browsing, interpreted in the context of each page’s purpose. |
| Bounce rate | The share of sessions without engagement as defined by GA4, rather than simply single-page visits. |
GA4’s engagement definition considers duration, key events and page or screen views. An unusually favourable rate may also be a reason to check how events are configured.
Example: sessions are growing but form submissions are flat. Look at landing pages and conversions to understand which visits contribute to the business.
3. Choose a view for your question
| Your question | Open | Look at |
|---|---|---|
| Which pages are viewed? | Pages | Views, users and engagement. |
| Where do visits start? | Pages → Landing Pages | The volume and quality of entry sessions. |
| Which section is improving? | Pages → Répertoires | Directory paths such as /blog/ and /collections/. |
| Where do visitors come from? | Sources | Acquisition channels and referring sites. |
| Who uses the website, and on which device? | Audience | Countries and devices. |
| Do AI assistants send visits? | AI | Recognisable AI sources in acquisition data. |
| Which actions take place? | Conversions | Events, tracking goals or e-commerce revenue. |
| Where should we investigate? | Insights | Channel and page comparisons, depending on available data. |
Exit Pages uses an estimated non-engagement score based on views and engagement rate. It is not an exact GA4 exit count; use it to identify pages worth investigating.
The AI view recognises sources in measured traffic. It does not count every mention of your brand in assistant responses, or visits whose referrer was not passed on.
4. Understand acquisition
In Sources, start with acquisition channels, then use referring sites to understand the origin of visits more precisely.
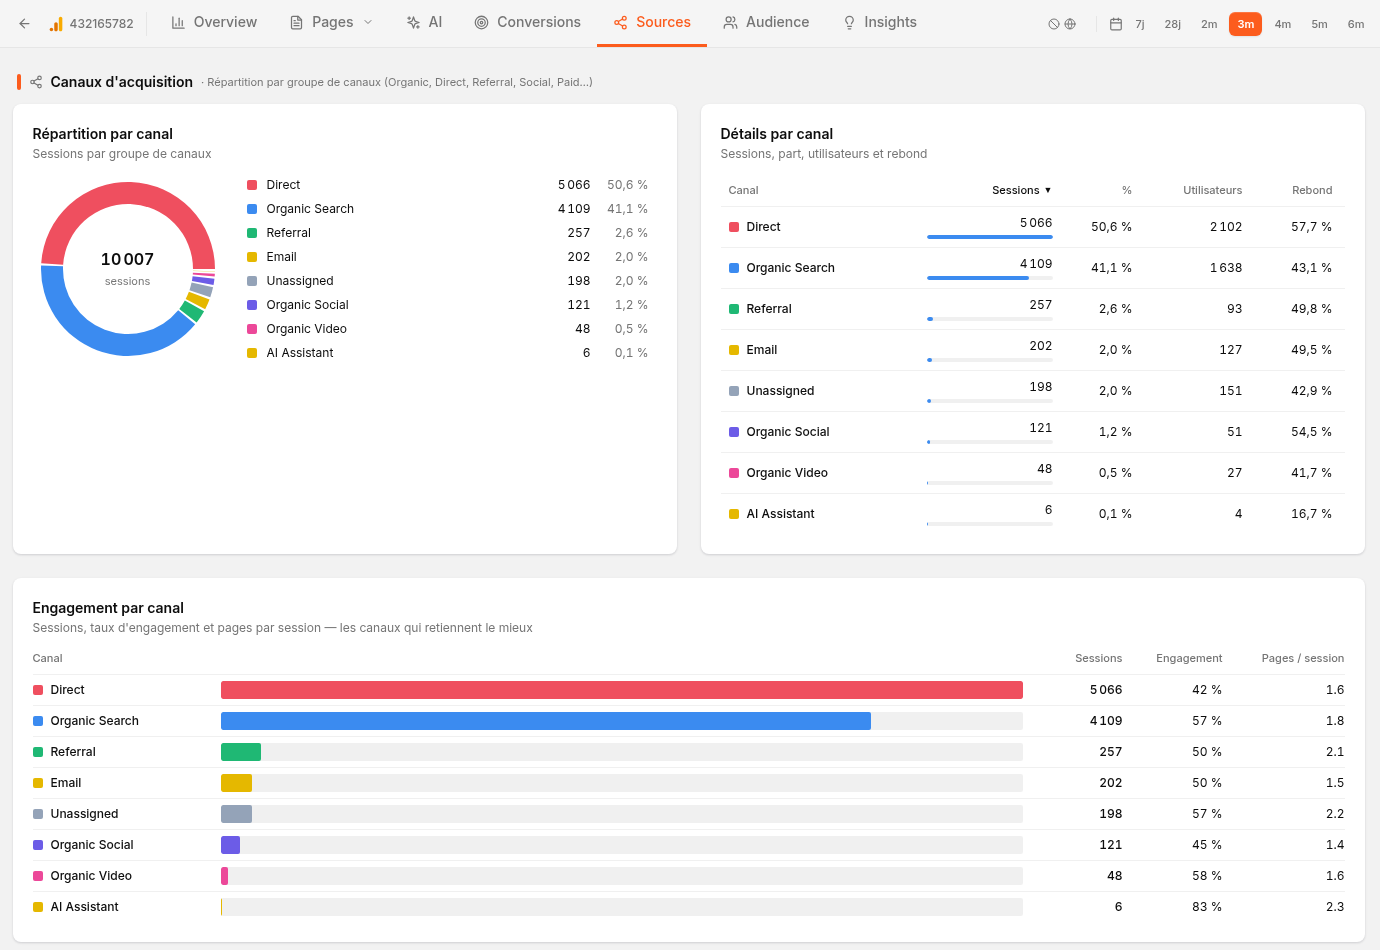 Acquisition channels, session volumes and engagement in Sources. Screenshot from the French interface.
For SEO work, compare organic traffic with other channels. For a link campaign, also look for visits from websites mentioning you. A backlink can exist without sending a measurable visit: GA4 is not a backlink inventory.
You can exclude countries using the control at the top. When an associated project has page groups, the cluster selector narrows compatible analyses. A group needs at least one positive matching rule, such as /collections/.
Check the scope: filtering pages does not turn a session metric into a page metric. Conversions and Insights also load their own analyses; do not assume that every metric uses the filters in the top bar. Check the scope before comparing totals.
5. Track meaningful conversions
Conversions has two modes: e-commerce revenue (Revenue e-commerce) and goals and events (Objectifs & événements). The initial mode depends on the property’s data; you can switch between them.
Forms, sign-ups and contact requests
In goals and events, click the star beside an event to follow it as a Cuik conversion. Depending on the existing setup, GA4 key events may already be selected when the view first opens.
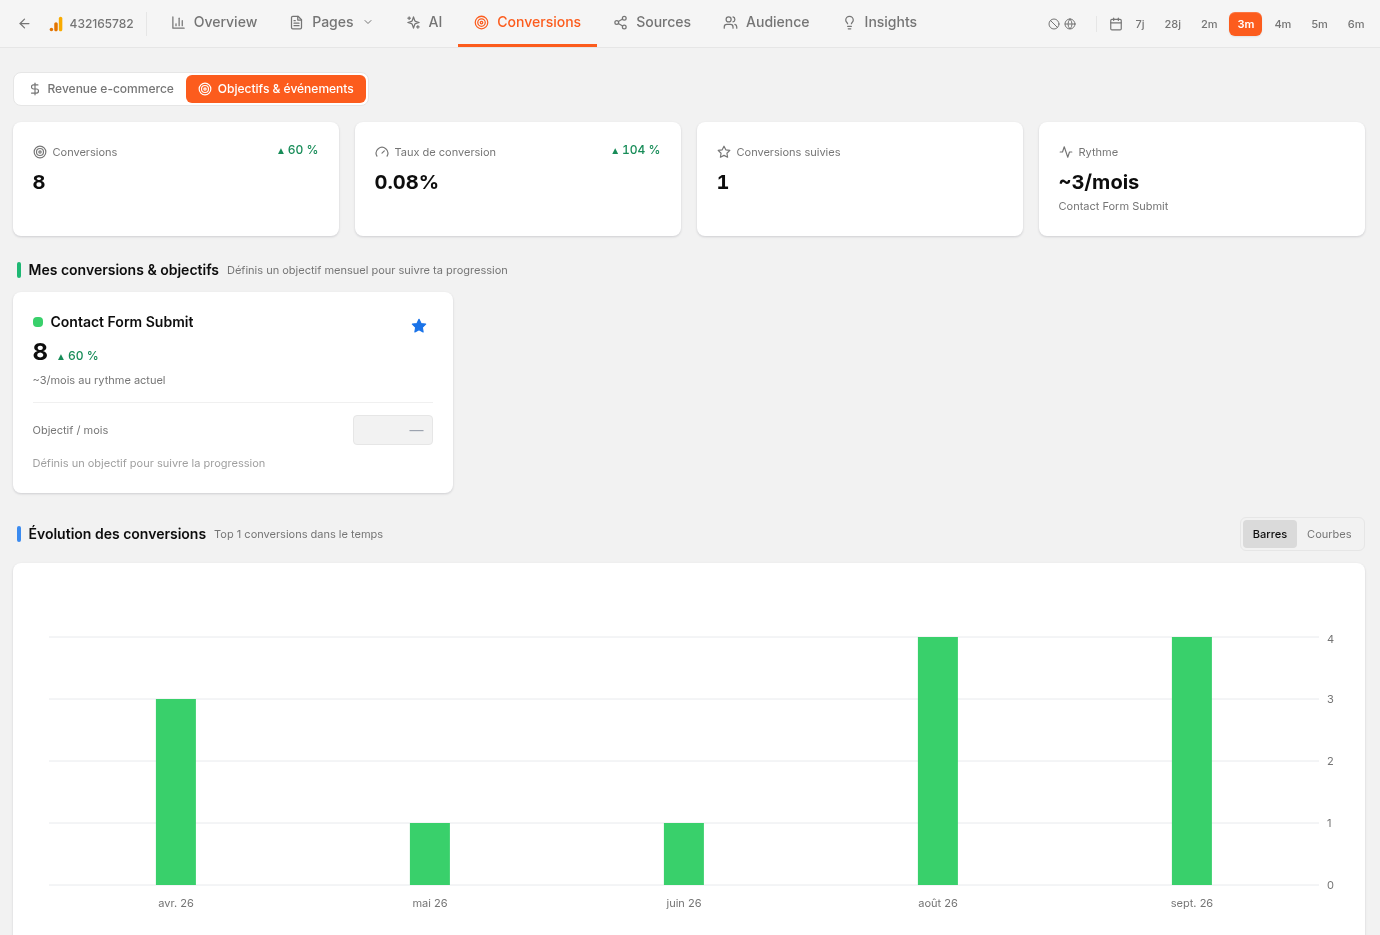 Events from the Cuik property and the actions selected for tracking. These figures illustrate this project, not a target to copy.
- Select actions relevant to your business:
form_submit, a sign-up or a custom event that your site actually records. - Optionally enter a monthly target in the conversion card.
- Compare volumes, trends and channel contributions. The displayed monthly pace is an extrapolation from the selected period, not a guaranteed forecast.
The selection and targets are currently saved in your browser for each property. They do not change key events in Google Analytics and are not automatically synchronised with your colleagues’ browsers.
Event totals count occurrences, not necessarily unique customers. Cuik’s rate divides selected event occurrences by sessions; several actions in one visit can push it above 100%. Adding two form totals does not automatically produce a deduplicated lead count.
Online sales
In the e-commerce view, explore purchases, revenue and purchase journey stages when your website sends those events. Without correctly collected e-commerce events, Cuik cannot reconstruct sales. Starring an event in Cuik does not replace website tracking configuration.
6. Turn analysis into a client report
Associate the correct Google Analytics property with your project, then open Reports. Choose a suitable starter template or add GA4 charts from the catalogue. Set the report’s period separately; do not assume it matches the Analytics tab.
For a service business, a useful report sequence could be:
- Acquisition: organic sessions and their trend over the period.
- Pages: leading landing pages and engagement.
- Outcome: recorded enquiries, naming the event being measured.
- Analysis: what changed and which page needs attention.
For layout, branding and a viewing link, read Create, customise and share a report.
If you use Cuik MCP, describe the question and the limits of the analysis:
Investigate fewer enquiries
For project [domain], compare the last 28 complete days with the previous period using Google Analytics. Examine organic sessions, landing pages and the event [exact name]. Separate observations from hypotheses and occurrences from users. Flag missing data or permissions. Suggest three checks before changing the report or creating tasks.7. Explain missing or different figures
| Situation | First check |
|---|---|
| No data | Correct property, a period with traffic and working website tracking. |
| Missing event | Its exact name and whether GA4 recorded it during this period. |
| Figures differ from GA4 | Dates, filters, metric definitions and scope: user, session or event. |
| Sessions differ from Search Console clicks | These measure different things; consent and collection also affect measured visits. |
| A tab fails to load | The displayed error, Google permissions and any request limit. Retry after the indicated delay. |
An empty table alone does not establish that nobody performed an action. Check data collection before drawing a conclusion about the website’s performance.