
Create, customise and share a report
From your first report to the client presentation: sources, charts, pages, agency branding and sharing settings.
On this page
A Cuik report brings together data, charts and your analysis in a presentation using your agency’s branding. This guide follows a monthly SEO report from creation to client delivery. Screenshots show the French interface.
Create your first report
Open your project → Reports → New report. Choose a Cuik template to start with composed pages, or Blank report to build your presentation. Name it, then choose Create.
Choose your starting point
For a visibility report, start with the Search Console template. For acquisition, choose Analytics. Available templates depend on the sources connected to the project.
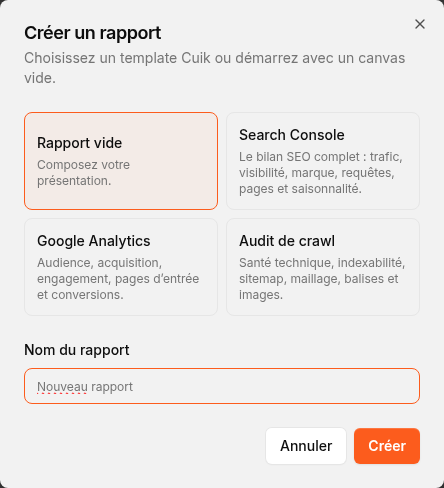 French interface · Project → Reports → New report.
If a template is unavailable, connect its required source in project settings. Pages combining several sources are added only when the necessary sources are connected.
The building blocks
| Item | Purpose |
|---|---|
| Report | The whole presentation, with its date range and theme. |
| Page | One slide: a cover, chapter or content page. |
| Element | A chart, table, metric or text block placed on a page. |
| Theme | Reusable branding: logo, backgrounds, text and chart colours. |
A template is a starting point. You can edit its pages, remove elements and add your own analysis.
Choose sources and dates
The icons at the top of the studio give access to the project’s sources. Check the selected property before interpreting the figures.
| Source | What it provides |
|---|---|
| Search Console | Google visibility: clicks, impressions, queries, pages and positions. |
| Analytics | Audience, acquisition, engagement and events from the GA4 property. |
| Crawl | The technical state of the site observed in the selected crawl. |
| Combined sources | Analyses connecting the available sources. |
Click the date range at the top of the report. Choose Monthly, 3 months or Custom, then compare with the previous year or previous period. Done closes the selector.
A crawl remains a dated observation: changing the report’s month does not start a new crawl. A chart can also have its own filters; open its settings to check its scope.
Data loads for the selected scope. To regenerate it, open Advanced options → Generate. Wait for loading to finish before sharing.
Example: for an August review, select August and compare with July. To study seasonality, compare with August of the previous year instead. State that comparison in the introduction.
Build your report pages
Choose Add in the right panel to open the Catalogue.
- Ready-to-use pages adds a complete composition with several elements already arranged on a slide.
- Elements adds a chart, table, metric or another block to your chosen page.
- Create an element opens the editor to build a chart using the available data.
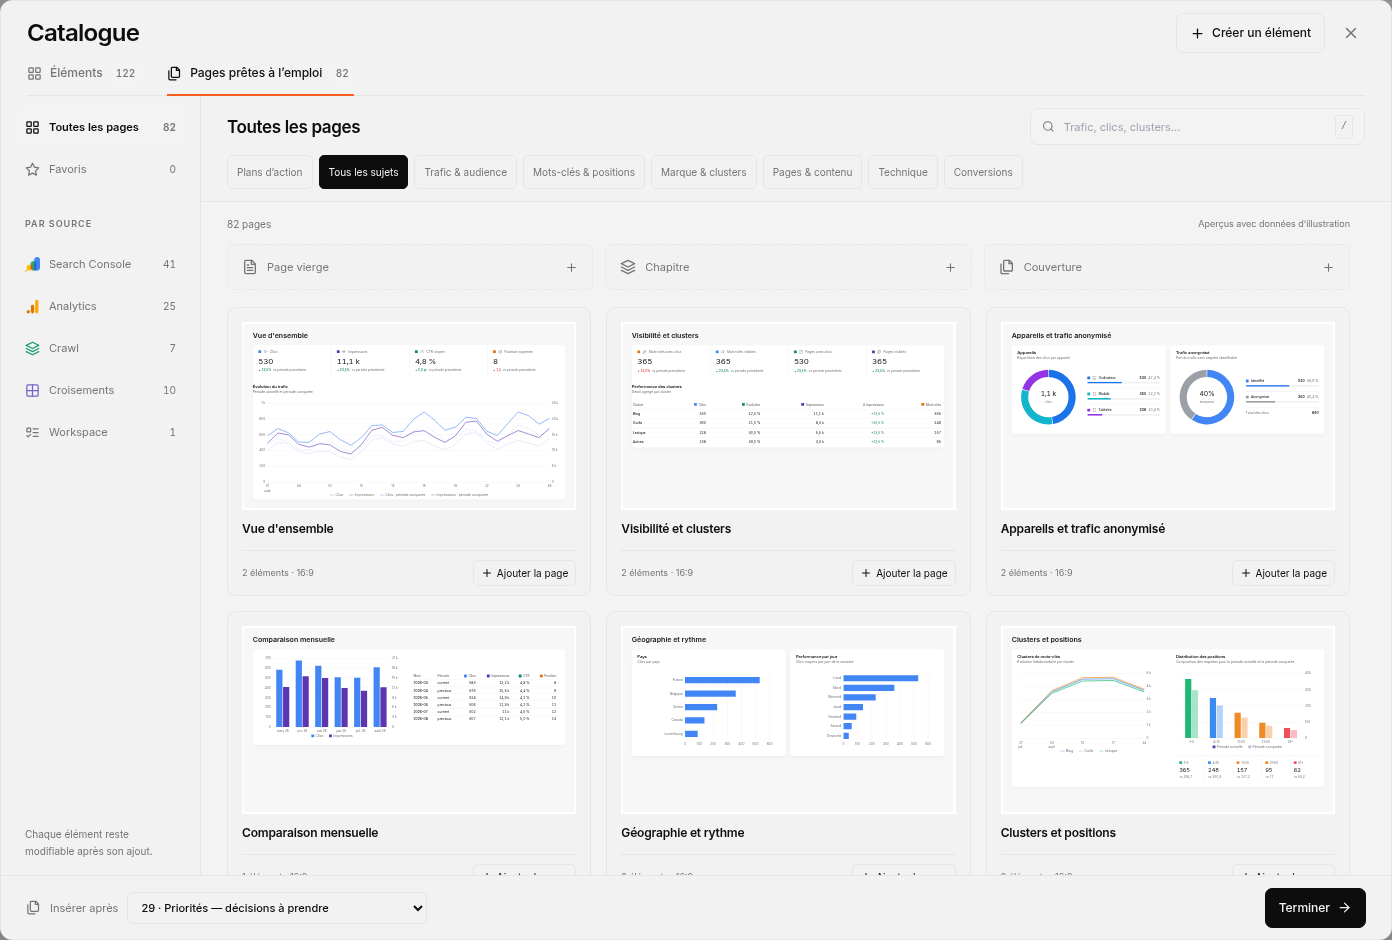 French interface · Add → Catalogue. Select a page or an element; choose its destination at the bottom.
Use search, topics or sources to find a visual. Catalogue previews use illustrative data; the report’s data is used once an item is added.
At the bottom, Insert after sets the position of a new page. For an element, Add to selects its destination page. You can add several items before choosing Done.
The star adds a page or element to your Favourites. Favourites also appear first in their list, so you can find your usual visuals without searching every month.
Arrange the result
Open Report outline to find pages and their elements. Select a page to customise it. Page controls also let you move it, insert a page after it or delete it.
Elements can be moved between pages. A block in To place remains in the studio but is excluded from the PDF: put it on a page if you want to present it.
A first report can use a short structure: cover → results → detailed analysis → next actions. Add a chapter when several pages cover the same topic.
Edit charts and explain the figures
Select a chart, then Edit. Depending on the element, the editor offers source, format, metric, series, filter and colour settings. Check the preview, then Save.
A line chart shows change over time; bars compare categories; a table provides detail. Change the format when it makes the answer clearer, without adding multiple charts that say the same thing.
Inspect a chart’s underlying data
Choose View data where available. The table lets you search rows and export CSV. Depending on the chart, it contains the displayed values or the underlying source detail.
The scope, dates and limits shown in this window matter: a partial or limited table may not represent the whole property. Missing chart data can come from the source, date range or selected filters.
Add your analysis
Use Text on a page, then the text editor to write and format your analysis. Report headings and text are also editable within the presentation.
A useful annotation answers a specific question: what changed, where, and what action follows? For example: “The decline is concentrated on collection pages. Review their internal links before changing all product pages.”
The studio’s Data chat lets you request analysis and inspect its proposals. Review the figures and explanations before adding them to the report.
Prepare an analysis with the assistant
In this report, compare the selected date range with its reference period. Identify the pages contributing most to the change in clicks. Propose a chart and a short analysis. State the sources and limitations, and separate observed facts from hypotheses.Apply your agency’s branding
Open Advanced options → Agency themes. Start from a preset or one of your themes, then adjust the agency name, logo, backgrounds, text and series colours.
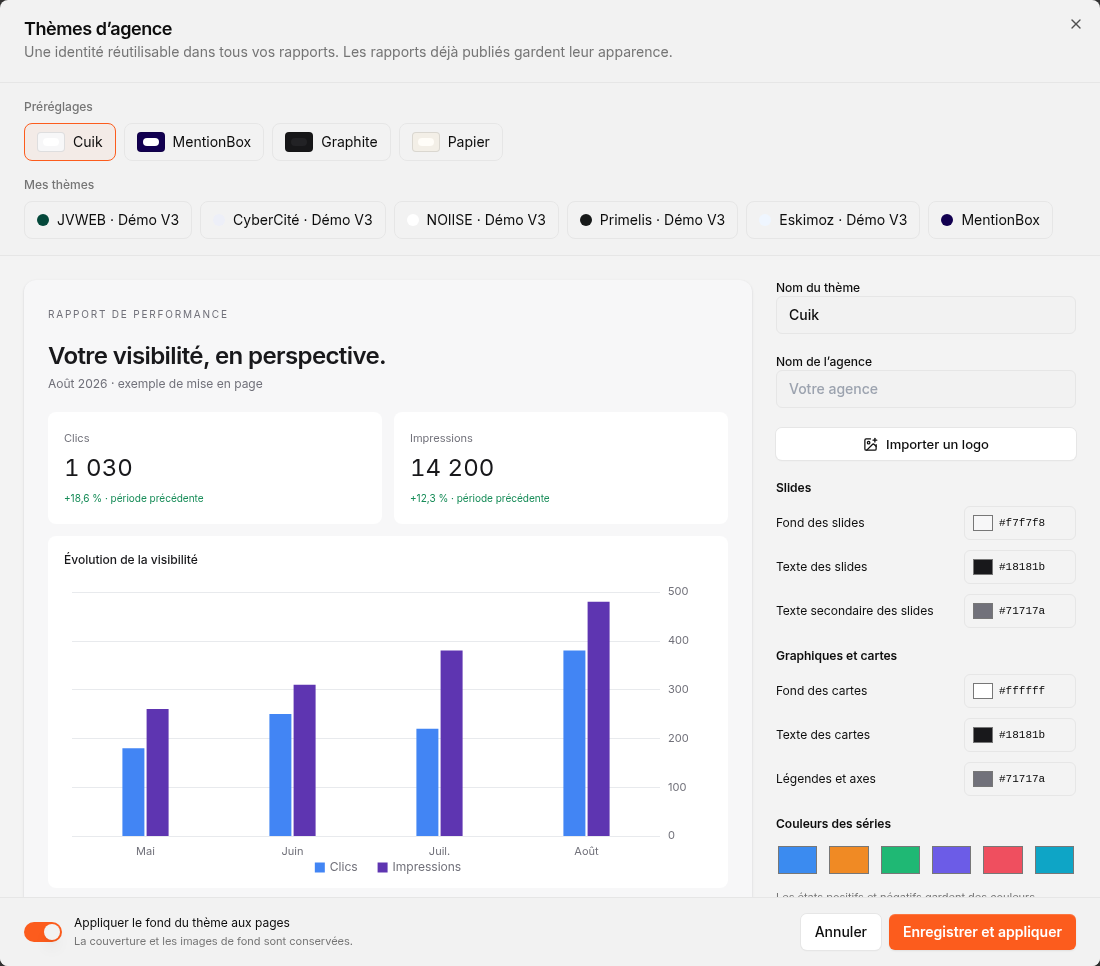 French interface · Agency themes previews slides, cards and charts together.
Choose Save and apply to save the theme to your library and apply it to the report. You can then select it in other reports.
- Logos support PNG, JPEG or WebP images under 5 MB.
- Colours customised on an individual chart take precedence over theme colours.
- Apply the theme background to pages preserves the cover and background images.
- Editing a theme does not automatically change an already published version.
Customise a cover or page
Select the page, then Customise page. Adjust the layout, text, elements and background; cover pages also have templates. Choose Save to apply your changes.
The theme defines the shared visual identity. Page customisation defines the composition. You can use an expressive cover and simpler analysis pages while keeping the same branding.
To reuse a composition, the editor’s Export and Import commands exchange its layout file. This is a page composition, not a PDF export of the report.
Share a version with your client
Choose Share at the top of the studio. Set the options and link expiry, then choose Create a sharing link. Once publishing finishes, use Copy link or Open.
Set access before creating the link
Your client can view the presentation without an account. Comments and access to data tables are separate options.
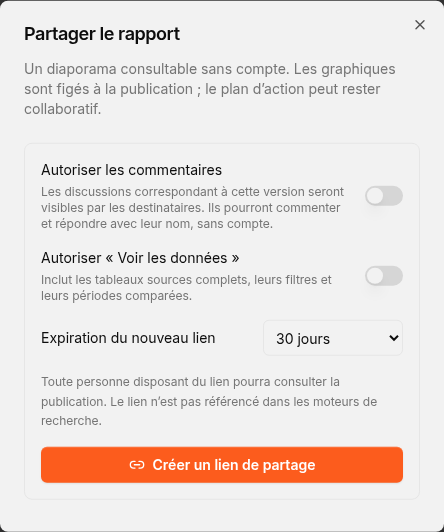 French interface · Share: choose permissions and link duration.
| Option | What the recipient can do |
|---|---|
| Comments | View discussions for this version, comment and reply using their name. |
| View data | Consult the source tables included in the publication, with their filters and comparisons. |
| CSV export | Download tables; this option appears when data access is enabled. |
| Action plan management | When this block is present, add and edit tasks, assignees and tags; changes sync to the workspace. |
| Expiry | Choose 7, 30 or 90 days, or no expiry. |
Anyone with a valid link can access the publication according to these settings. A Cuik account is not required.
Draft and publication are separate
Charts are frozen when published. Subsequent studio edits do not immediately change the client’s version.
To update that same link, return to Share → Refresh. To preserve the previous version, create a new link. Changing the comments option on an existing link also republishes the current version.
You can revoke a link from this window. It stops working; files already downloaded remain with their recipients.
To use your own address, read the custom domain guide.
Present and export to PDF
Flow mode displays content continuously on screen. Pages mode shows 16:9 sheets, useful for checking page boundaries and crowding before presenting.
- Slideshow opens a full-screen presentation. Use the arrows to navigate and Escape to exit.
- Export to PDF, the printer icon, opens the browser’s print workflow. Choose Save as PDF as the destination.
If the studio reports that content overflows a page, open Customise page and adjust the layout. Blocks left in To place are excluded from the PDF.
A PDF is static. A shared link provides the presentation and any interactions you allowed.
Prepare the next review
Reuse Cuik templates as a starting structure, favourites for recurring visuals and agency themes for branding. These three tools avoid repeating the same setup.
You can change the working report’s date range to prepare the next edition. Review the analysis text: changing dates does not rewrite your conclusions. Then publish a new link if you want to keep each monthly review separate.
Next actions can be tracked in the workspace and, when needed, included in the report using the Action plan block. The project management guide explains cards, questions and approvals.